Introduction
The expansion of digital record-keeping by police departments across the U.S. in the 1990s ushered in the era of data-driven policing. Huge metropolises like New York City crunched reams of crime and arrest data to find and target “hot spots” for extra policing. Researchers at the time found that this reduced crime without necessarily displacing it to other parts of the city—although some of the tactics used, such as stop-and-frisk, were ultimately criticized by a federal judge, among others, as civil rights abuses.
The next development in data-informed policing was ripped from the pages of science fiction: software that promised to take a jumble of local crime data and spit out accurate forecasts of where criminals are likely to strike next, promising to stop crime in its tracks. One of the first, and reportedly most widely used, is PredPol, its name an amalgamation of the words “predictive policing.” The software was derived from an algorithm used to predict earthquake aftershocks that was developed by professors at UCLA and released in 2011. By sending officers to patrol these algorithmically predicted hot spots, these programs promise they will deter illegal behavior.
But law enforcement critics had their own prediction: that the algorithms would send cops to patrol the same neighborhoods they say police always have, those populated by people of color. Because the software relies on past crime data, they said, it would reproduce police departments’ ingrained patterns and perpetuate racial injustice, covering it with a veneer of objective, data-driven science.
PredPol has repeatedly said those criticisms are off-base. The algorithm doesn’t incorporate race data, which, the company says, “eliminates the possibility for privacy or civil rights violations seen with other intelligence-led or predictive policing models.”
There have been few independent, empirical reviews of predictive policing software because the companies that make these programs have not publicly released their raw data.
A seminal, data-driven study about PredPol published in 2016 did not involve actual predictions. Rather the researchers, Kristian Lum and William Isaac, fed drug crime data from Oakland, California, into PredPol’s open-source algorithm to see what it would predict. They found that it would have disproportionately targeted Black and Latino neighborhoods, despite survey data that shows people of all races use drugs at similar rates.
PredPol’s founders conducted their own research two years later using Los Angeles data and said they found the overall rate of arrests for people of color was about the same whether PredPol software or human police analysts made the crime hot spot predictions. Their point was that their software was not worse in terms of arrests for people of color than nonalgorithmic policing.
However, a study published in 2018 by a team of researchers led by one of PredPol’s founders showed that Indianapolis’s Latino population would have endured “from 200% to 400% the amount of patrol as white populations” had it been deployed there, and its Black population would have been subjected to “150% to 250% the amount of patrol compared to white populations.” The researchers said they found a way to tweak the algorithm to reduce that disproportion but that it would result in less accurate predictions—though they said it would still be “potentially more accurate” than human predictions.
In written responses to our questions, the company’s CEO said the company did not change its algorithm in response to that research because the alternate version would “reduce the protection provided to vulnerable neighborhoods with the highest victimization rates.” He also said the company did not provide the study to its law enforcement clients because it “was an academic study conducted independently of PredPol.”
Other predictive police programs have also come under scrutiny. In 2017, the Chicago Sun-Times obtained a database of the city’s Strategic Subject List, which used an algorithm to identify people at risk of becoming victims or perpetrators of violent, gun-related crime. The newspaper reported that 85% of people that the algorithm saddled with the highest risk scores were Black men—some with no violent criminal record whatsoever.
Last year, the Tampa Bay Times published an investigation analyzing the list of people that were forecast to commit future crimes by the Pasco Sheriff’s Office’s predictive tools. Deputies were dispatched to check on people on the list more than 12,500 times. The newspaper reported that at least one in 10 of the people on the list were minors, and many of those young people had only one or two prior arrests yet were subjected to thousands of checks.
For our analysis, we obtained a trove of PredPol crime prediction data that has never before been released by PredPol for unaffiliated academic or journalistic analysis. Gizmodo found it exposed on the open web (the portal is now secured) and downloaded more than 7 million PredPol crime predictions for dozens of American cities and some overseas locations between 2018 and 2021.
This makes our investigation the first independent effort to examine actual PredPol crime predictions in cities around the country, bringing quantitative facts to the debate about predictive policing and whether it eliminates or perpetuates racial and ethnic bias.
We examined predictions in 38 cities and counties crisscrossing the country, from Fresno, California, to Niles, Illinois, to Orange County, Florida, to Piscataway, New Jersey. We supplemented our inquiry with Census data, including racial and ethnic identities and household incomes of people living in each jurisdiction—both in areas that the algorithm targeted for enforcement and those it did not target.
Overall, we found that PredPol’s algorithm relentlessly targeted the Census block groups in each jurisdiction that were the most heavily populated by people of color and the poor, particularly those containing public and subsidized housing. The algorithm generated far fewer predictions for block groups with more White residents.
Analyzing entire jurisdictions, we observed that the proportion of Black and Latino residents was higher in the most-targeted block groups and lower in the least-targeted block groups (about 10% of which had zero predictions) compared to the overall jurisdiction. We also observed the opposite trend for the White population: The least-targeted block groups contained a higher proportion of White residents than the jurisdiction overall, and the most-targeted block groups contained a lower proportion.
For more than half (20) of the jurisdictions in our data, the majority of White residents lived in block groups that were targeted less than the median or not at all. The same could only be said for the Black population in four jurisdictions and for the Latino population in seven.
When we ran a statistical analysis, it showed that as the number of crime predictions for block groups increased, the proportion of the Black and Latino populations also increased and the White population decreased.
We also found that PredPol’s predictions often fell disproportionately in places where the poorest residents live. For the majority of jurisdictions (27) in our data set, a higher proportion of the jurisdiction’s low-income households live in the block groups that were targeted the most. In some jurisdictions, all of its subsidized and public housing is located in block groups PredPol targeted more than the median.
We focused on census block groups, clusters of blocks that generally have a population of between 600 to 3,000 people because these were the smallest geographic units for which recent race and income data was available at the time of our analysis (2018 American Community Survey).
Block groups are larger than the 500-by-500-square-foot prediction squares that PredPol’s algorithm produces. As a result, the populations in the larger block groups could be different from the prediction squares. To measure the potential impact, we conducted a secondary analysis at the block level using 2010 Census data for blocks whose populations remained relatively stable. (See Limitations for how we define stable.)
We found that in nearly 66% of the 131 stable block groups, predictions clustered on the blocks with the most Black or Latino residents inside of those block groups. Zooming in on blocks showed that predictions that appeared to target majority-White block groups had in fact targeted the blocks nestled inside of them where more Black and Latino people lived. This was true for 78% of the 46 stable, majority-White block groups in our sample.
To try to determine the effects of PredPol predictions on crime and policing, we filed more than 100 public records requests and compiled a database of more than 600,000 arrests, police stops, and use-of-force incidents. But most agencies refused to give us any data. Only 11 provided at least some of the necessary data.
For the 11 departments that provided arrest data, we found that rates of arrest in predicted areas remained the same whether PredPol predicted a crime that day or not. In other words, we did not find a strong correlation between arrests and predictions. (See the Limitations section for more information about this analysis.)
We do not definitively know how police acted on any individual crime prediction because we were refused that data by nearly every police department. Only one department provided more than a few days’ worth of concurrent data extracted from PredPol that reports when police responded to the predictions, and that data was so sparse as to raise questions about its accuracy.
To determine whether the algorithm’s targeting mirrored existing arrest patterns for each department, we analyzed arrest statistics by race for 29 of the agencies in our data using data from the FBI’s Uniform Crime Reporting (UCR) project. We found that the socioeconomic characteristics of the neighborhoods that the algorithm targeted mirrored existing patterns of disproportionate arrests of people of color.
In 90% of the jurisdictions, per capita arrests were higher for Black people than White people—or any other racial group included in the dataset. This is in line with national trends. (See Limitations for more information about UCR data.)
Overall, our analysis suggests that the algorithm, at best, reproduced how officers have been policing, and at worst, would reinforce those patterns if its policing recommendations were followed.
Data Gathering and Preparation
We discovered access to PredPol prediction data through a page on the Los Angeles Police Department’s public-facing website that contained a list of PredPol reporting areas with links. Those links led to an unsecured cloud storage space on Amazon Web Services belonging to PredPol that contained tens of thousands of documents, including PDFs, geospatial data, and HTML files for dozens of departments, not just the LAPD. The data was left open and available, without asking for a password to access it. (Access has since been locked down.)
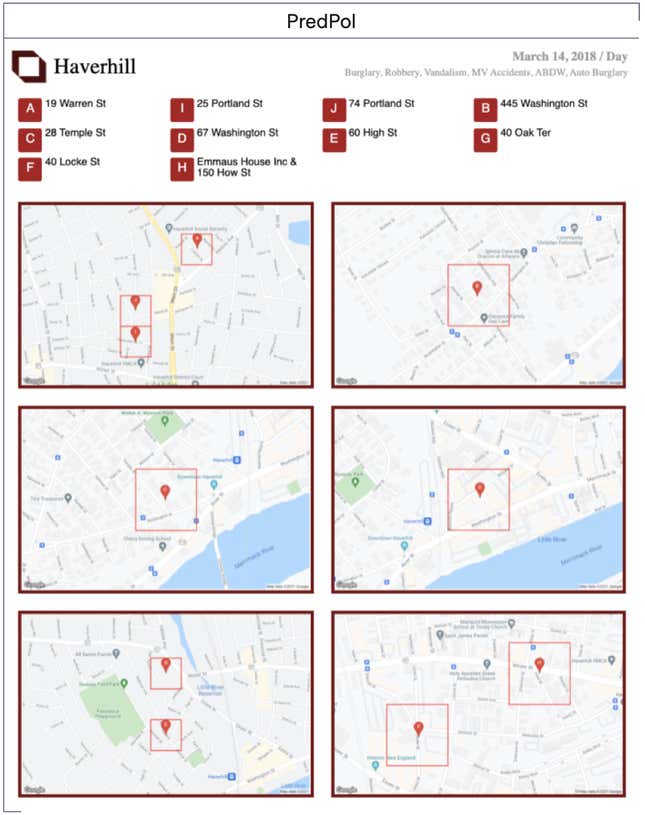
We first downloaded all the available data to our own database on June 8, 2020, using a cloud storage management tool developed by Amazon. We downloaded the data again and updated our analysis on Jan. 31, 2021. This captured a total of 7.8 million individual predictions for 70 different jurisdictions. These took the form of single-page maps indicating addresses, each marking the center of 500-by-500-foot boxes that the software recommended officers patrol during specific shifts to deter crime. Each report’s HTML code was formatted with the prediction’s date, time, and location. That allowed us to investigate patterns in PredPol predictions over time.
Of the 70 agencies in our dataset, we had less than six months of predictions for 10 of them and six others were empty folders. Not all the agencies were U.S.-based or even policing agencies—some were private security firms. One was using PredPol to predict oil theft and other crimes in Venezuela’s Boscán oil field, while another was using PredPol to predict protests in Bahrain. While these uses raise interesting questions, they fell outside the scope of our current investigation.
We limited our analysis to U.S. city and county law enforcement agencies for which we had at least six months’ worth of data. We confirmed with the law enforcement agency, other media reports, and/or signed contracts that they had used PredPol in the time period for which we had reports and the stop and start dates for each city. This reduced the list to 38 agencies.
For 20 of these 38 departments, some predictions in our data fell outside the stop/start dates provided by law enforcement, so we removed these predictions from the final data used for our analysis, in an abundance of caution. The final dataset we used for analysis contained more than 5.9 million predictions.
To determine which communities were singled out for additional patrol by the software, we collected demographic information from the Census Bureau for each department’s entire jurisdiction, not only the prediction locations.
For police departments, we assumed their jurisdictions included every block group in the city, an official boundary the Census calls a “census-designated place.” (See more in the Limitations section.) Sheriff’s departments were more complicated because in some cases their home county includes cities they do not patrol. For those, we obtained the sheriff departments’ patrol maps and used an online tool called Census Reporter to compile a list of every block group within the disclosed jurisdiction.
We looked up the census tracts and block groups for the coordinates of every prediction in our database using the Census’s geocoding API. The census tracts and block groups used in our analysis were drawn during the 2010 Census. We gathered demographic data for these areas from the five-year population estimates in the 2018 American Community Survey (ACS), the most recent survey available when we began our investigation.
The ACS only provides demographic information down to the block-group level—subdivisions of a census tract that generally include between 600 and 3,000 people and take up an average of 39 blocks. These are significantly larger than the prediction boxes, which are just shy of six acres or about the size of a square city block, but we had no good alternative. Smaller, block-level demographic data from the Census Bureau for 2020 is not scheduled to be released until 2022. The block-level data available during our investigation is more than 10 years old, and we found that the demographic changes since then in the majority of block groups in our data were significant (30% or more for the block groups’ Black, Latino, or White populations). (See more in the Limitations section.)
Layering on the Census ACS data from 2018 allowed us to carry out a disparate impact analysis about the people who lived in areas the PredPol software targeted at that time—and those who lived in areas that were not targeted.
Prediction Analysis and Findings
Methods
Given the quantity and various types of data we gathered, we used various methods of analysis for this investigation, each of which will be described in detail in subsequent sections.
We carried out several disparate impact analyses seeking to discern whether predictions fell more heavily on communities of color, low-income communities, and blocks containing public housing.
For the race/ethnicity and income analyses, we merged 2018 American Community Survey data and prediction data and observed the makeup of block groups that were targeted above and below the median; those targeted the most; and those targeted the least. (We also analyzed the data in a continuous manner to confirm that our findings were due to an underlying trend, not spurious observations.)
We also conducted a limited disparate impact analysis at the smaller, block-level scale using 2010 Census data.
For the public housing disparate impact analysis, we gathered data released by the federal Department of Housing and Urban Development on the location of subsidized and public housing in all of the jurisdictions in our data, mapped them out, and observed the frequency of PredPol predictions for those locations.
To examine possible relationships between predictions and law enforcement actions, we analyzed more than 270,000 arrest records from 11 agencies, 333,000 pedestrian or traffic stops from eight agencies, and 300 use-of-force records from five agencies, all of which were released under public records laws. (Most agencies did not provide records.)
We also examined arrest rates by race/ethnicity for 29 of the 38 jurisdictions in our final dataset using data from the FBI’s Uniform Crime Reporting program.
Lastly, six agencies provided disaggregated arrest data that included race, and we examined this data to discern arrest rates across racial groups for some crime types, such as cannabis possession.
Disparate Impact Analysis
Frequent police contact, like frequent exposure to a pollutant, can have an adverse effect on individuals and result in consequences that extend across entire communities. A 2019 study published in the American Sociological Review found that increased policing in targeted hot spots in New York City under Operation Impact lowered the educational performance of Black boys from those neighborhoods. Another 2019 study found that the more times young boys are stopped by police, the more likely they are to report engaging in delinquent behavior six, 12, and 18 months later.
We carried out a disparate impact analysis to assess which, if any, demographic groups would be disproportionately exposed to potential police interactions if the agencies had acted on recommendations provided by PredPol’s software. We analyzed the distribution of PredPol predictions for each jurisdiction at the geographic level of a census block group, which is a cluster of blocks with a population of between 600 to 3,000 people, generally.
Block groups in our data were made up of 28 blocks, on average, and contained an average of 1,600 residents. As stated earlier, these were much larger than PredPol’s 500-by-500-foot prediction squares but are the smallest geographic unit for which recent government information about the race, ethnicity, and household income of its inhabitants was available at the time of our investigation.
There was significant variation in the length of time each of the 38 jurisdictions in our analysis used the software during our window of access, and which crimes they used it to predict. There was also a huge difference in the average number of predictions on block groups among jurisdictions, which varied from eight to 7,967.
The 38 jurisdictions were of varying sizes; Jacksonville, Texas, was the smallest, with 13 block groups, and Los Angeles the largest, with 2,515 block groups.
We calculated the total number of predictions per block group in each jurisdiction. We then sorted the block groups in each jurisdiction by their prediction counts and created three categories for analysis.
We defined the “most-targeted block groups” as those in each jurisdiction that encompassed the highest 5% of predictions, which corresponded to between one and 125 block groups. We defined the “median-targeted block groups” as the 5% of each jurisdiction’s block groups straddling the median block group for predictions. And we defined the “least-targeted block groups” as each jurisdiction’s block groups with the bottom 5% of predictions.
We also calculated whether the majority (more than 50%) of a jurisdiction’s demographic group lived in the block groups targeted more or less than the median.
We chose to define the most-targeted and least-targeted groups using the 5% metric rather than using alternative methods, such as the Interquartile Range (IQR).
With the IQR method, we would consider block groups below the 25th percentile to be the least targeted and block groups above the 75th percentile to be the most targeted, but this did not fit our requirements because of the large volume of zero-prediction block groups (10%). Using the IQR method, the average percentage of a jurisdiction’s block groups in the most-targeted group would have been 7% of the jurisdiction’s block groups, whereas the average in the least-targeted group would have made up 71% of the jurisdiction’s block groups. This difference is too large to make a meaningful comparison of the demographic composition of the least- and most-targeted block groups. This is why we chose to use 5% for the least- and most-targeted groups.
In some of the larger jurisdictions, more than 5% of block groups received zero predictions. In those cases, we chose the most-populated block groups with no predictions for the 5%. We also ran an analysis in which we counted every block group with zero predictions as the least-targeted block groups, and the findings did not change significantly. (See Limitations for more.)
The analysis consisted of the following steps:
1. Sort the list of block groups from most targeted to least targeted and label the most targeted, median targeted or least targeted as defined above.
2. Get ACS population data at the block-group-level for the following demographic populations:
- a) Race: African American, Asian, Latino, and White.
- b) Household Income: Less than $45,000, $75,000–$100,000, $125,000–$150,000, Greater than $200,000
3. Calculate the proportion for each demographic group d in a jurisdiction’s most-targeted, median-targeted, and least-targeted block groups. Hence we calculate 3×38 values of dt:
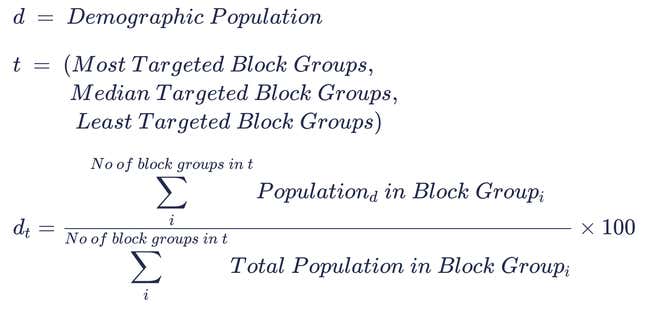
4. Calculate the proportion for each demographic group d, in all the block groups in the jurisdiction j. This gives us 38 values for dj:

5. To determine if a demographic group’s proportion in the most-, median-, or least-targeted blocks is greater than it is in the jurisdiction overall, we simply compare the values. For each jurisdiction, we compare the three values of dt to dj. We present the results aggregated across all jurisdictions:

6. We also calculated what proportion of a jurisdiction’s demographic group d lived in the block groups targeted more and less than the median:

7. Using these values we can calculate the number of jurisdictions where the demographic majority lives in the most- and least-targeted blocks. After carrying out the comparisons individually for each jurisdiction, we present the aggregated results.

We acquired block group demographic data from the Census Bureau’s 2018 American Community Survey. We conducted our analysis for race/ethnicity and household income. Not every jurisdiction had reliable estimates at the block group level for each racial or income group because some populations were too small.
For our main analysis, we focused on the demographic composition of the most- and least-targeted blocks as well as those targeted more than the median and less than the median. Doing so allowed us to measure the disparate impact in a way that is clear yet simple to understand. In order to ensure we weren’t cherry-picking statistics, we also carried out an analysis that preserved the continuous nature of the data.
For each of our 38 jurisdictions, we looked at the relationship between the following variable pairs at the level of the census block group:
- Prediction count and population of Race (Asian, African American, Latino, and White)
- Prediction count and number of Households at different income ranges (Greater than $200,000, Between $125,000 and $150,000, Between $75,000 and $100,000, and Less than $45,000).
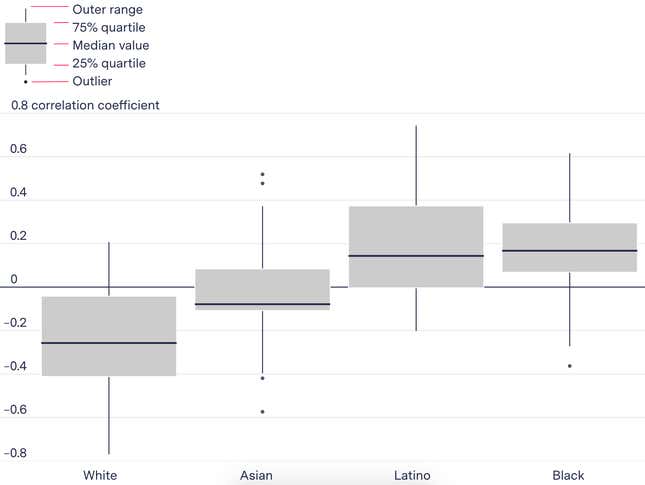
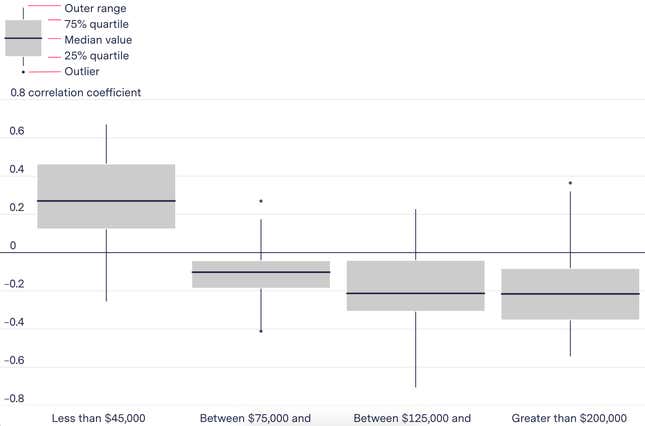
We calculated the Spearman correlation coefficient and used a box plot to visualize the distribution of correlation coefficients for each pair of variables and calculated the median coefficient values across all 38 jurisdictions. This analysis allowed us to measure if, for a given jurisdiction, the prediction count that a block group received is correlated to the race/ethnicity or income of the people living in it.
We chose to calculate individual coefficients for each jurisdiction, rather than collapsing all the block groups across jurisdictions into one analysis since they are independent distributions. There could be meaningful differences between jurisdictions’ policing practices, and there are definitely significant variations in the number of block groups and the racial and household income composition of the people living in each of them, as well as the total number of predictions they received. For this reason, we analyzed each jurisdiction individually and examined the distribution of those correlation coefficients to see if a pattern emerged.
For our final analysis, we looked at the demographic composition of the 38 jurisdictions individually by binning the block groups into discrete buckets based on the number of predictions they received. We made 10 equal-sized bins based on the percentile score of a block group in a given jurisdiction. The first bin had block groups that had between 0 predictions and the 10th percentile, and the last bin had block groups that were between the 90th and 100th percentile. We then calculated the demographic composition of the collection of block groups in each of these bins. Doing this allowed us to observe if there was any relationship between the composition of the racial/ethnic or income groups in each of these bins and the predictions it received. Unlike our previous analysis, this method includes all the block groups in each jurisdiction. We present the averaged results across all jurisdictions in the following two sections and provide the results for individual jurisdictions in our GitHub.
In order to measure the accuracy of our findings, we used the margin of errors for population estimates present in the 2018 ACS data to run our analysis on the lower and upper bounds of each block group’s population estimates. This allowed us to measure how much our findings varied due to ACS data inaccuracies. There wasn’t a significant change in our findings for African American, Asian, Latino, or White populations, or for different median household income ranges, no matter which population estimate we used.
To err on the side of caution throughout this methodology, we state our findings with the lowest of the three values we calculated (e.g., “at least 63% of jurisdictions”).
The only demographic group for which the findings varied significantly was Native Americans, so we didn’t use those findings in our analysis.
To determine whether focusing on a smaller geography would affect our findings, we completed a secondary analysis at the block level using 2010 data and found even greater disparities (more in the next section and Limitations).
Race and Ethnicity Analysis
Most- and Least-Targeted Block Groups
For the majority of jurisdictions we analyzed, the most-targeted block groups had a higher Black or Latino population while block groups that were never or infrequently targeted tended to have a higher White population when compared to the jurisdiction as a whole.
In a majority of 38 jurisdictions, more Blacks and Latinos lived in block groups that were most targeted, while more Whites lived in those that were least targeted.
In at least 84% of departments (32), a higher proportion of Black or Latino residents lived in the most-targeted block groups compared to the jurisdiction overall. Looking only at Black residents, a higher proportion lived in the most-targeted block groups in 66% of jurisdictions (25), and for Latinos alone, it’s 55% of jurisdictions (21).
This same phenomenon was less common for Asian residents. In at least 34% of jurisdictions (13), Asian populations in the most-targeted block groups exceed the jurisdiction’s median Asian population. It was the least common for White people. In at least 21% of jurisdictions (8) a higher proportion of White residents live in the block groups most targeted by PredPol’s software than the jurisdiction overall.
Conversely, when we looked at the block groups least targeted by PredPol’s software, their demographics were reversed. For at least 74% of the policing agencies in our data (28 jurisdictions) the proportion of White residents in the least-targeted block groups was higher than the jurisdiction overall. This was true for Blacks and Latinos much less often, in at least 16% (6) and 18% (7) of jurisdictions, respectively.
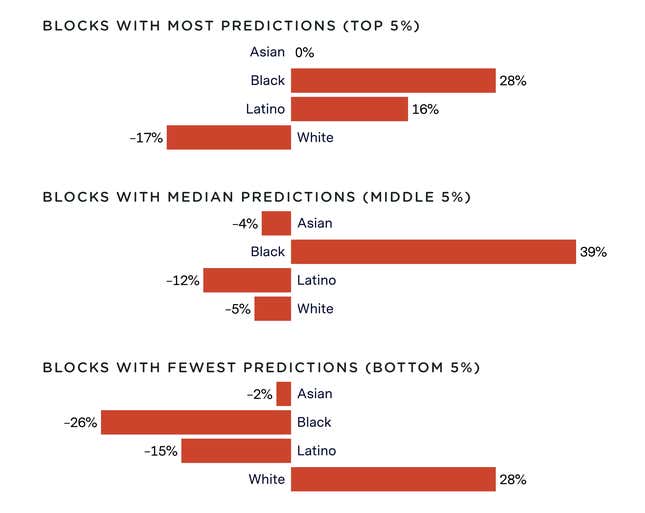
Analyzing the most-targeted blocks from all 38 jurisdictions, we found the African American and Latino proportion increased by 28% and 16% on average, and the average White population decreased by 17%. The opposite trend was true for the least-targeted blocks.
As predictions increased, the proportion of Blacks and Latinos in block groups increased. The opposite was true for Whites.
In Salisbury, Maryland, at least 26% of residents in the jurisdiction’s median block group are Black, according to the Census Bureau. However, the Black population jumped to at least 5%, on average, for block groups that were most targeted by PredPol.
In Portage, Michigan, the most-targeted block groups contained at least nine times as many Black residents as the median-targeted block groups in the city and at least seven times as many Black residents as the city overall.
And the number of predictions in these most-targeted areas was often overwhelming.
In one block group in Jacksonville, Texas (block group 1 of the 950500 census tract), PredPol predicted that either an assault or a vehicle burglary would occur at one of various locations in that block group 12,187 times over nearly two years. That’s 19 predictions each and every day in an area with a population of 1,810 people. This block group’s population is at least 62% Black and Latino and between 15% and 21% White.
In fact, at least 83% of Jacksonville’s Black population lived in block groups that were targeted more than 7,500 times in two years. This was many times more than the percentage of the city’s White population that lived in those block groups (at least 23%).
When we asked PredPol about it, the company said Jacksonville was misusing the software for some of the time, using too many daily shifts, which resulted in extra predictions per day. (See more in the Company Response section.) The Jacksonville police did not respond to requests for comment.
Block Groups Above and Below the Median
We also found that for at least 76% of the jurisdictions in our data (29), a majority of a jurisdiction’s Black or Latino population lived in the block groups PredPol targeted more than the median. A majority of Asian residents lived in these block groups for at least 55% of jurisdictions in our data.
The algorithm largely spared White residents from the same level of scrutiny it recommended for Black and Latino residents.
For more than half (20) of the jurisdictions in our data, the majority of White residents lived in block groups that were targeted less than the median or not at all. The same could only be said for the Black population in four jurisdictions and for the Latino population in seven.
Block-Level Race Analysis
Advocates for hot spot policing stress that the small size of the prediction area is crucial. To determine whether focusing on a smaller geography would affect our findings, we completed a secondary analysis at the block level using 2010 Census data. To reduce the effects of population shifts over the ensuing decade, we limited this analysis to block groups with at least one prediction in our dataset where Black, Latino, and White populations did not change more than 20% between the 2010 Census and the 2018 ACS. Asian and Native American populations were too small for this secondary analysis. For our dataset, 20% proved to be a good threshold for selecting block groups where the demographic population shifts were small.
In the resulting 135 reasonably stable block groups (2% of the block groups in our data), we found that 89 of the targeted blocks within them had even higher concentrations of Black and Latino residents than the overall block group. (See more in the Limitations section.)
In some cases, zooming in on blocks showed that predictions that appeared to target majority White block groups had in fact targeted the blocks within them where people of color lived. For example, every single prediction in a majority White block group in Los Angeles’s Northridge neighborhood (block group 2 of the 115401 census tract) occurred on a block whose residents were almost all Latino. The most-targeted block in a majority White block group in Elgin, Illinois. (block group 1 of the 851000 Census tract), had seven times more Black residents than the rest of the block group.
For 36 (78%) of the 46 stable, majority-White block groups, predictions most frequently targeted the blocks inside of them that had higher percentages of Black or Latino residents. In only 18 (36%) of the 50 stable, majority-Black and -Hispanic block groups did the most-targeted blocks have higher percentages of White people than the block group overall.
Correlation Between Predictions and Race
We analyzed the relationship between the volume of predictions a block group received and its race and ethnic makeup using the Spearman correlation coefficient. We calculated the correlation coefficient for all 38 jurisdictions individually. For each jurisdiction, we calculated four coefficients, one for each race/ethnicity in our analysis. Thus, we had 38 × 4 coefficients. We visualized the distribution to surface the underlying trend.
The data suggests that as the number of predictions in a block group increases, the Black and Latino proportion of the population increases and the White and Asian proportion of the population decreases. While the median correlation is low, there is a lot of variation. This may be the result of the algorithm echoing existing policing practices or because some jurisdictions in the data are much more segregated than others.
As mentioned previously, PredPol’s prediction boxes are much smaller than a block group. Since the correlation coefficients are calculated at the level of the block group, they would not pick up the sort of targeting that we describe in the previous section, where even within some White-majority block groups, the most-targeted blocks were the ones where people of color lived. Thus these correlation coefficients are more conservative than the one carried out at the level of a census block.
We were not able to carry out this analysis at that more granular level due to the limitations of the block-level Census demographic data available to us.
As the number of predictions in a block group increased, the Black and Latino proportion of the population increased

Race/Ethnicity Composition of Deciles
To observe how the compositions of different race/ethnicity groups changed across block groups as a property of predictions, we binned the block groups into discrete buckets based on the number of predictions they received and calculated the proportion of the race/ethnicity and income groups in our analysis that lived in the collection of block groups in each bin.
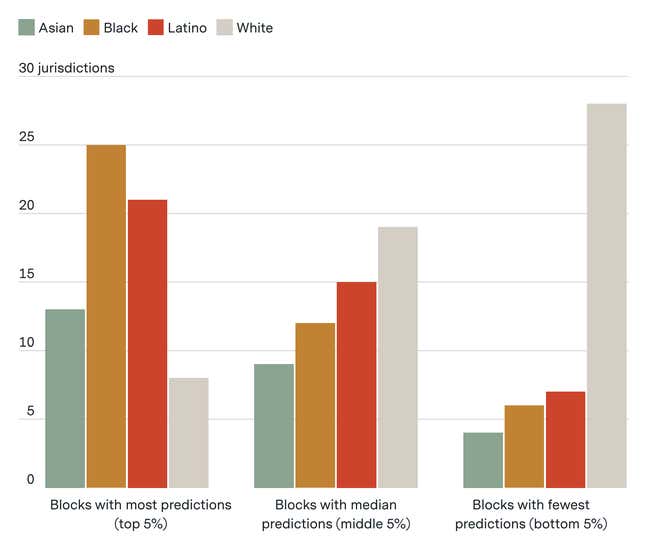
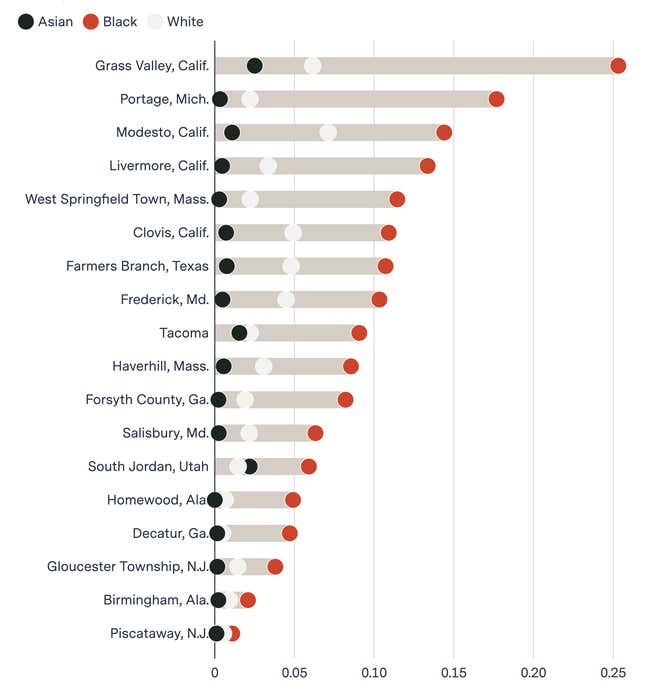
After calculating these values for each of our 38 jurisdictions individually, we calculated the mean value for each bucket across all jurisdictions. This is shown in the chart below. The figure shows that, on average, as the number of predictions a block group received increases, the proportion of the Black and Latino populations increases and the White population decreases.
Neighborhoods with the most predictions had the lowest share of White residents.
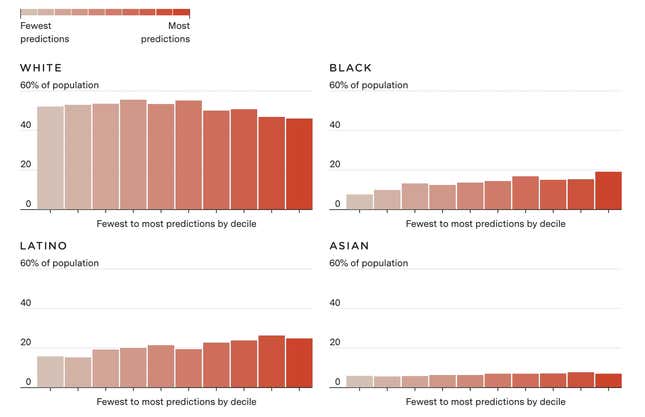
Our analysis showed that the most-targeted block groups had a higher Black or Latino population than the jurisdiction as a whole, while block groups that were never or infrequently targeted tended to have a higher percentage of White residents than the jurisdiction as a whole.
To see how the demographic composition changed for any individual jurisdiction, see our GitHub here.
Wealth and Poverty Analysis
Joining prediction data with the Census Bureau’s 2018 American Community Survey data also gave us insight into the financial strata of those living in areas targeted by PredPol.
The federal poverty line, at $26,200 a year income for a family of four, is widely criticized as too low a measure to provide an accurate picture of all the people experiencing financial and food insecurity in America. To capture a broader swath of lower-income families than the poverty line allows, we chose a different federal metric: the income threshold for public school students to qualify for the federal free and reduced lunch program, which is $48,000 annually for a family of four. We rounded down to $45,000 because that was as close as the Census data could get us.
In our 38 jurisdictions, we observed significant variation in the upper income range. Some had almost no households that made more than $200,000, while for others they made up 15% of the jurisdiction. To account for the variation, we used three different higher income ranges to try to capture wealthier neighborhoods in different municipalities. These ranges were chosen using what was available in the Census’s table for household Income in the past 12 months.
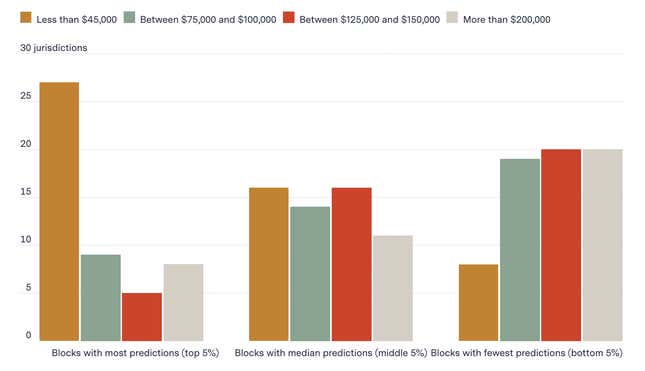
We counted the number of households in each Census block group with an annual income of $45,000 or less as well as the following groupings: $75,000 to $100,00, $125,000 to $150,000, and more than $200,000. We then calculated what percentage of each jurisdiction’s portion of these income groups was located in block groups in the most-, median- and least-targeted areas for PredPol predictions, as we had for the racial and ethnic analysis.
Most- and Least-Targeted Block Groups
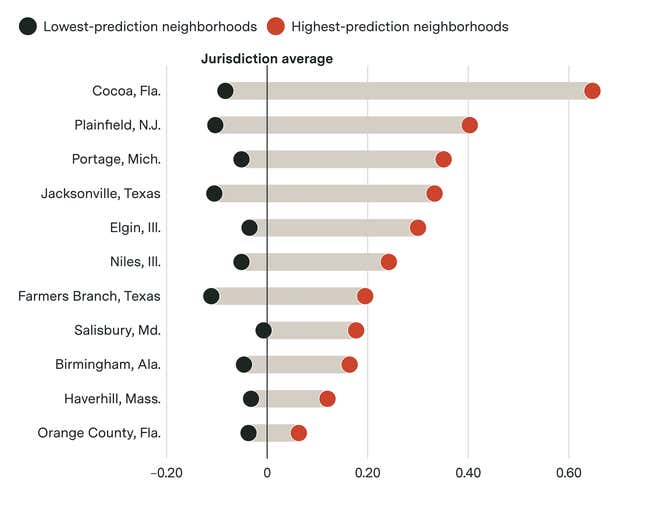
Our analysis found that, compared to the jurisdiction as a whole, a higher proportion of a jurisdiction’s low-income households lived in the block groups PredPol’s software targeted the most, and a higher proportion of middle-class and wealthy households lived in the block groups it targeted the least.
In at least 71% of jurisdictions (27) in our data set, a higher proportion of low-income households (annual income $45,000 or less) lived in the block groups most targeted by PredPol’s software compared to the jurisdiction overall. This was true for households that made more than $200,000 in at least 21% of jurisdictions (8).
In 30 jurisdictions, the most-targeted block groups had poorer households.
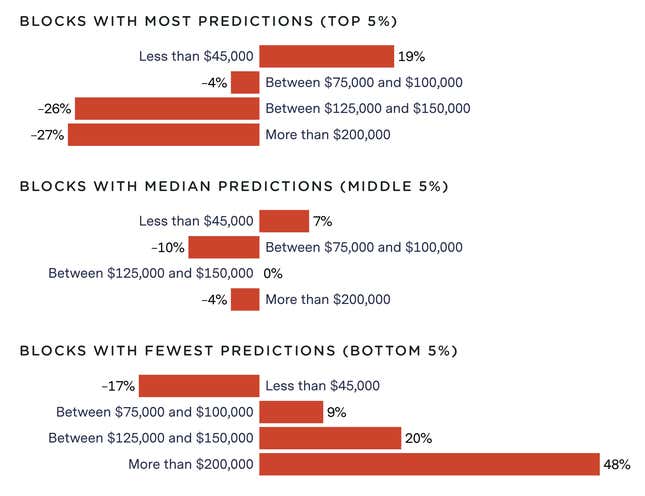
Looking at the most-targeted blocks in all 38 jurisdictions in our dataset, the proportion of households that earned less than $45,000 on average increased by 18%, and the average proportion of households that earned more than $200,000 decreased by 26%. The opposite trend was true for the least-targeted blocks.
As predictions increased, poorer households increased and wealthy ones decreased.
In some places, the disparity was even more dramatic. In Haverhill, Massachusetts, for instance, at least 21% of the jurisdiction’s 4,503 low-income households were located in the most-targeted block groups. In Decatur, Georgia, at least one in three (34%) of the jurisdiction’s low-income households lived in two block groups that PredPol targeted constantly—more than 11,000 predictions each over almost three years.
We also looked at the distribution of wealthier households in jurisdictions and compared those to PredPol predictions. We found that block groups that were never targeted tended to be wealthier. For a majority of the jurisdictions in our data, Census block groups that PredPol targeted the least were composed of more households that earned at least $200,000 a year than in the jurisdiction overall.
In Merced, California, for instance, the least-targeted block groups had at least 10 wealthy households on average. The median-targeted block groups had none. And in Birmingham, Alabama, the median block group didn’t have a single wealthy household. But block groups where PredPol never made predictions had at least 34 wealthier households on average.
To see how the demographic composition of the neighborhoods changed in an individual jurisdiction based on the software’s targeting, see our GitHub here.
Block Groups Above and Below the Median
We also found that for 33 jurisdictions (87%), the majority of the jurisdiction’s low-income households were located in the block groups targeted more than the median. In only 13 jurisdictions (34%) did a majority of households earning $200,000 or more live in block groups targeted more than the median.
Correlation Between Predictions and Income
We analyzed the relationship between the volume of predictions a block group received and the income range of the people living there. For each jurisdiction, we calculated four coefficients, one for each income range in our analysis. Thus, we had 38 × 4 coefficients. We visualized the distribution to surface the underlying trend.
We found a weak positive correlation between the proportion of households that make less than $45,000 a year and the number of predictions a block group receives and a weak negative correlation for the rest of the income levels. This means the data suggests that as the prediction count increases, the proportion of households that make less than $45,000 a year increases.
The proportion of households earning less than $45,000 a year positively correlated with predictions

Income Composition of Deciles
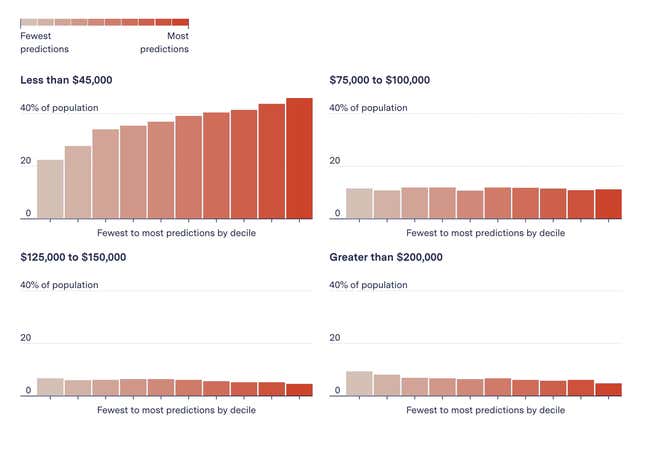
To observe how the composition of household income ranges changed across block groups as a function of predictions, we binned the block groups into discrete buckets based on the number of predictions they received and calculated the proportion of people of each income range in our analysis that lived there.
After calculating the distribution for each of our 38 jurisdictions individually, we calculated the mean value for each bucket across all block groups. This is shown in the figure below. The figure shows the same trend we observed in our previous analysis: Looking at the data for all 38 jurisdictions together, on average, as the number of predictions a block group received increases, the proportion of households that make less than $45,000 a year increases.
As predictions increased, average household income decreased
Our analysis found that, compared to the jurisdiction as a whole, a higher proportion of a jurisdiction’s low-income households lived in the block groups PredPol’s software targeted the most, and a higher proportion of wealthy households lived in the block groups it targeted the least. We also found that across the entire distribution as the predictions a block group received increased, the proportion of households making $45,000 a year or less also increased. To see how the composition changed for individual jurisdictions, see our Github here.
Public Housing Analysis
As we continued to explore these most-predicted areas, we noticed a large number were in and around public housing complexes, home to some of the nation’s poorest residents.
Using HUD’s online housing lookup tool, we gathered the locations of 4,001 public or private subsidized housing communities, homeless shelters, and elderly and special needs housing in the jurisdictions in our data. We then looked at the frequency with which PredPol predicted a crime would occur there.
For 22 jurisdictions in our data (57%), more than three-quarters of their public housing facilities were located in block groups that PredPol targeted more than the median. For some jurisdictions, a majority of public housing was located in the most-targeted block groups:
- In Jacksonville, 63% of public housing was located in the block groups PredPol targeted the most.
- In Elgin, 58% of public housing was located in the block groups PredPol targeted the most.
- In Portage; Livermore, California; Cocoa, Florida; South Jordan, Utah; Gloucester, New Jersey; and Piscataway, every single public housing facility was located in block groups that were targeted the most.
In 10 jurisdictions, PredPol predicted crimes in blocks with public housing communities nearly every single day the program was in use there. (Since this analysis did not require Census demographic data, we counted the number of predictions for their locations.)
We were able to get arrest data for some of these departments, but when we compared it to the rate and type of predictions made, they could be miles apart.
For example, PredPol predicted that assault would occur an average of five times a day at the Sweet Union Apartments, a public housing community in Jacksonville—3,276 predictions over the 614 days that the Jacksonville Police Department used the software during the period we analyzed. PredPol said Jacksonville had at some point created too many shifts, so it was receiving repeat predictions. The police department did not respond to requests for comment.
It is unknown whether police increased patrols in those areas as a result (see more in Limitations). Arrest data provided by the Jacksonville police showed that officers made 31 arrests there over that time. Only four were for domestic violence or assault. The majority of the other 27 violations were outstanding warrants or drug possession.
Stops, Arrests, and Use of Force
We sought to determine the effect of PredPol predictions on commonly collected law enforcement data: stops, arrests, and use of force.
To do that, we made more than 100 public records requests to 43 agencies in our data for their use-of-force, crime, stop, and arrest data from 2018 through 2020. We focused on jurisdictions where PredPol predictions disproportionately targeted Black, Latino, or low-income neighborhoods and where the software predicted nonproperty crime types.
We also requested “dosage” data, which is PredPol’s term for data the software provides agencies that track when officers visit each prediction box and how much time they spent there—but the requests were roundly denied by nearly every agency, many on the grounds that the agency has stopped using PredPol and could no longer access the information.
Some agencies refused to give us any data at all; others gave us some data. Only two—Plainfield, New Jersey, and Portage—gave us all the types of data we requested.
We obtained data for pedestrian or traffic stops from eight agencies, arrest data from 11 agencies, and officer use-of-force incidents from five agencies. Some of the use-of-force records were provided as written reports rather than data, so we pulled out the metadata to build spreadsheets. Each set of new data was then checked against the original records by another journalist on the project.
We geolocated each arrest, stop, or use of force incident to a latitude/longitude coordinate. This allowed us to check whether the incident occurred on the same day as a PredPol prediction and within 250 feet of the center of the 500-by-500-foot box suggested for patrol (called “inside the box” by PredPol).
When an agency did not provide us with any data, we gathered jurisdiction-level arrest statistics from the FBI’s Uniform Crime Reporting program.
Stop, Arrest, and Use of Force Analysis
PredPol claims that using its software is likely to lead to fewer arrests because sending officers to the company’s prediction boxes creates a deterrent effect. However, we did not observe PredPol having a measurable impact on arrest rates, in either direction. (See Limitations for more about this analysis.)
While these findings are limited, a closer examination of the block groups that PredPol targeted most frequently suggests that the software recommended that police return to the same majority Black and Latino blocks where they had already been making arrests.
When we compared per capita arrests in the block groups that PredPol targeted most frequently—those in the top 5% for predictions—with the rest of the jurisdiction, we found they had higher arrests per capita than both the least-targeted block groups and the jurisdiction overall. These areas of high arrests also have higher concentrations of Black and Latino residents than the overall jurisdiction, according to Census data.
For example, data provided by Salisbury, Georgia, from 2018 to 2020 shows per capita arrests on the most-targeted block groups, those in the top 5% for predictions, were nearly seven times the arrest rate of the jurisdiction as a whole. The proportion of Black and Latino residents living in these most-targeted block groups is twice that of the jurisdiction as a whole, according to Census figures.
Neighborhoods with the most crime predictions had higher arrest rates.
This same pattern repeated for all 11 departments that provided us with disaggregated arrest data: The block groups most targeted by PredPol had both higher percentages of Black or Latino residents and higher arrests per capita than the jurisdiction overall.
We found a similar pattern for the agencies that provided us with data about use-of-force incidents. For three out of the five of them, per capita use-of-force rates were higher in the most-targeted block groups than the overall jurisdiction.
In Plainfield, per capita use-of-force rates in the jurisdiction’s most-targeted block groups were nearly two times the entire jurisdiction’s rate. In Niles, Illinois, per capita use-of-force in the most-targeted block groups was more than two times the jurisdiction’s rate. In Piscataway., it was more than 10 times the jurisdiction’s rate.
Arrests and use-of-force incidents are influenced by far too many variables to attribute statistical changes or any particular contact directly to PredPol predictions without further evidence.
We reviewed police reports we were able to obtain and, in some neighborhoods, arrests in prediction areas seemed to be mostly in response to calls for service while in others, many of the arrests were of the “curious cop” variety, where the officer initiated the contact without a crime report while on patrol. Even in those latter instances, we do not have direct confirmation that the PredPol prediction is what brought the police officer there that day.
While we cannot make any claims about causality, our findings show that both arrests of and police use of force on people of color were much more prevalent in the areas that PredPol targeted most frequently.
Overall Policing Patterns
Patterns of officers overpolicing people of color have been documented by researchers, civil rights activists, and the U.S. Department of Justice’s Civil Rights Division for decades.
We sought to examine whether the disproportionate pattern that we observed in PredPol’s predictions —targeting neighborhoods where people of color live—mirrored the agencies’ existing policing patterns. To do that, we analyzed the most widely available public data: arrests of people of color.
We gathered jurisdiction-level arrest statistics these agencies voluntarily report to the FBI’s Uniform Crime Reporting program (UCR). Three agencies in our dataset did not report crime statistics and, for six others, the UCR data was not disaggregated by race. Our analysis is based on the 29 remaining agencies.
We found that per capita arrest rates were higher for Black people than White people in 26 (90%) of the jurisdictions with usable statistics in our dataset. Officers in more than a third of these departments arrested Black people at more than three times the rate of White people. Officers in Decatur, for example, arrested Black people at a rate nine times that of White people.
These rates are somewhat understated, as no agency reported Latino arrest rates but rather reported arrests of people of that ethnicity as either White or Black. So part of the White arrest rate would include arrests of Latinos. (Only 18% of U.S. Latinos identify their race as Black, according to the Pew Research Center.)
Arrest rates tended to be higher for Black people than White people
For some types of charges, the differences in arrest rates between Black and White people in the jurisdictions we examined were breathtaking.
In Piscataway, New Jersey, a jurisdiction where PredPol made nearly 9,600 predictions for drug-related offenses, Black people were arrested for cannabis possession at a rate two times that of White people, proportionate to population. In Homewood, Alabama, the rate of cannabis arrests for Black people was 50 times that of White people. The National Survey on Drug Use and Health shows people of all races use drugs at similar rates.
When we analyzed individual arrest data for the six cities in our dataset that provided information about the arrestee’s race, we found that in each one Black people either were stopped, searched, arrested, or had force used against them by police at higher rates than any other racial group.
In Salisbury, for example, our analysis showed that Black people were stopped by officers at a rate twice as high as that of White people. During these stops, they were almost three times as likely to be searched and four times as likely to be arrested as White people.
There is a considerable body of academic and journalistic research supporting the idea that, across the country, people of color are disproportionately targeted by police for stops, arrests, and use-of-force. A study of millions of traffic stops in North Carolina found that Black and Latino people are more likely to be pulled over and searched than Whites, even though Whites were more likely to have illegal contraband on them. An analysis of police stops in Cincinnati, Ohio, showed that Black drivers constituted about three-quarters of arrests following a traffic stop but only made up 43% of the city’s population. A New York Times investigation found that police in Minneapolis, Minnesota, used force against Blacks seven times as frequently as against Whites.
Limitations
Prediction Data
Because of the way we obtained the data, we cannot be certain we’ve captured predictions for every jurisdiction using PredPol during the time period in our data: from Feb. 15, 2018, until Jan. 30, 2021. Public contracting records suggest that at least one department that is not in our dataset used PredPol between 2018 and 2020: Lakewood, Washington.
Since every coordinate in our dataset needed to be tied to corresponding Census data for the analysis, we disregarded any data that could not be geographically located by the Census API. This resulted in dropping 780 prediction locations out of 110,814, or 0.7%.
We were unable to investigate the “accuracy” of PredPol predictions—whether predicted crimes occurred on predicted days in predicted locations—nor do we know how each agency chose to respond to each prediction. As mentioned earlier, we asked every department to provide data about officer responses to PredPol predictions, which PredPol calls “dosage,” but only Plainfield and Portage provided any of that data. It is possible that some officers ignore PredPol reports entirely. Records for Plainfield showed officers responding to less than 2% of the total predictions that PredPol made for the department. How much of this is due to incomplete reporting by the department is impossible to know.
The Los Angeles Police Commission’s Office of the Inspector General found that LAPD officers’ response to PredPol predictions there varied wildly: Logs showed officers spent under a minute at most locations but in some cases stayed for more than an hour.
Classifying Least-Targeted Block Groups
In our analysis, we used 5% of a jurisdiction’s block groups as the window of analysis to classify the most-targeted, median-targeted, and least-targeted block groups. We chose 5% as it ensured non-overlapping block groups for small jurisdictions and still provided a reasonable sample size for comparison in the larger jurisdictions.
For 10 of the 38 jurisdictions, however, more than 5% of each of their block groups had no predictions. In those cases, we chose the most populous 5% of block groups with no predictions for analysis. To ensure this didn’t have a significant effect on our findings, we also ran our analysis by classifying all block groups with no predictions as the least-targeted block groups. If there were a significant difference in the demographic composition of those block groups, this analysis would allow us to observe that.
Running the analysis with all zero block groups classified as the least-targeted did not significantly change our analysis.
The number of departments showing racial or ethnic disparities in predictions changed by one or two, at most, depending on the group being examined. For the household income analysis, we saw no change in the distribution of households qualifying for free and reduced lunch. Three additional jurisdictions contained a higher percentage of households making more than $200,000 in the least-targeted group under the broader definition, and we saw a similar increase for households making $125,000–$150,000 and $75,000–$100,000 as well.
Given these small differences, we chose to keep the sample size consistent, since the analysis seemed easier to understand this way.
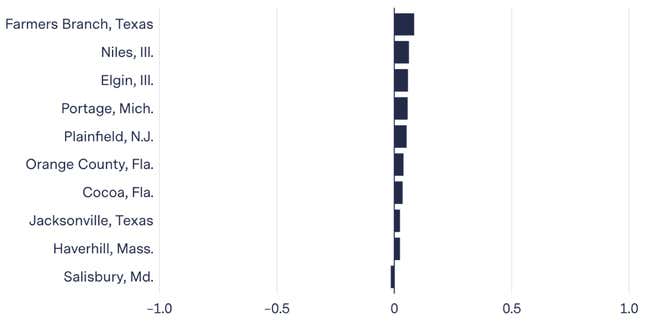
Jurisdictions That Didn’t Follow the Trend
For a handful of jurisdictions, the analysis did not show the same income and race/ethnicity trends as the other departments: Livermore, California; Calcasieu Parish, Louisiana; Forsyth County, Georgia; Boone County, Indiana; Temple Terrace, Florida; West Springfield Town, Massachusetts; South Jordan, Utah; Piscataway; Ocoee, Florida; and Farmers Branch, Texas. So we looked a bit deeper into their prediction locations.
In some of the jurisdictions, such as Farmers Branch, a significant number of predictions corresponded to parking lots for shopping centers, sports fields, and other commercial businesses located in more affluent, White neighborhoods. In our analysis, these predictions were counted toward the residents of the surrounding residential neighborhood even though the predictions were really targeting a commercial structure. Parking lots are widely known as common locations for car thefts and burglaries.
In other jurisdictions, such as Piscataway, a significant number of the predictions were labeled “DUI/DWI/Traffic.” These also targeted major roads and were near commercial areas. In our analysis, these were counted toward the residential, richer block groups surrounding them, which had high concentrations of White people, even though the predictions didn’t target those homes.
2018 American Community Survey Data
Our community exposure analysis relies on ACS five-year population estimates for race and poverty of residents at the census block group level, leaving us vulnerable to the margin of errors in the Census’s demographic data. Since margins of error can be quite high at the block group level, we used the lowest value of population estimate in this analysis. This is reflected throughout this methodology by the use of the term at least when talking about a particular demographic population.
We did not include individuals who identify as multiracial in our analysis.
Agency Jurisdictions
Census geographies do not necessarily map cleanly to law enforcement jurisdictions. As such, our jurisdiction maps may be slightly different from each agency’s actual patrol areas. For police departments, we assumed their jurisdiction included every block group in the city, an official boundary the Census calls a “census-designated place.”
We used Census Reporter to determine the block groups inside each “census-designated place” in our data. It is possible these miss some areas an agency patrols or include areas it does not patrol. For example, a local police department may contract its services to a transit authority or another government agency, potentially extending its patrol area beyond city limits.
We made the decision to limit our analysis to block groups in a jurisdiction’s census-designated place because we felt that, even if a given police department’s jurisdiction extends farther than these block groups, our findings within the city limits would still be accurate.
We do not expect that these unknown variables would change our findings significantly.
Sheriff departments were more complicated because in some cases, their county includes cities they do not patrol. For these agencies, we obtained their patrol maps and used Census Reporter to compile a list of every block group within the disclosed jurisdiction.
Block-Group-Level Data
In order to analyze the demographics of people living in the areas targeted by PredPol’s algorithm, we had to do our main analysis at the block group level, the smallest area available from the 2018 American Community Survey, which covered the time period in our dataset. The Census Bureau says it will not release block-level data from the 2020 Census until 2022.
Because of this, our main analysis does not perfectly calculate the racial, ethnic, and wealth characteristics of the residents “inside the box” for each prediction. The prediction boxes are 500 feet by 500 feet, or about the size of a city block. It is possible the micro-populations in those prediction boxes are slightly different from the overall block-group population. And sometimes the boxes encompass entirely commercial areas, where no one lives but which the surrounding community would frequent.
To test how using larger geographic locations may affect our findings, we conducted a secondary, block-level analysis using Census data from 2010, the most current available block-level data. Because those figures are stale and neighborhoods can change drastically in a decade, we limited the analysis to the most stable block groups.
We defined a stable block group as one whose Black, Latino, and White populations did not change more than 20% between the 2010 Census and the 2018 ACS. There are 154 block groups across 24 jurisdictions in our dataset that satisfy this definition. We looked specifically at the 135 stable block groups that received at least one prediction. From 2010 to 2018, these stable block groups on average lost 20 White and three Black residents and gained four Latino residents. These block groups average 2,163 residents.
Inside these 135 block groups were 4,710 blocks that were targeted by PredPol predictions. We found that even within a block group, the blocks most targeted by PredPol tended to have the highest concentration of Black or Latino residents. For 66% of the stable block groups in our analysis, the most-targeted block had a higher percentage of Black or Latino residents than the median block in the block group.
Measuring Arrest Rates
Arrest rates are dependent on a multitude of factors. We could not ascertain the direct effects of predictions on arrest or use-of-force rates overall because nearly every department denied our requests for data on whether and how officers responded to PredPol predictions. And for the two that did provide us with data on officer responses, it was either insufficient or unreliable. The Portage Police Department in Michigan provided us data for only two days out of the nearly three years we requested. Records provided by Plainfield showed officers responding to only 1% of the total predictions that PredPol made for the department. How much of this is due to incomplete reporting is impossible to know.
In the absence of this data, we examined possible linkages between arrests and PredPol predictions by comparing the average number of arrests and average number of predictions per block per week for the 10 jurisdictions we had data for. We calculated the correlation between the average number of arrests and average number of predictions per week. Given the limited data available to us, we were unable to find a strong correlation between predictions and arrests for any of the 10 departments in our dataset.
Correlations between predictions and arrests were weak
UCR, Arrest, and Use of Force Data
Data from local law enforcement arrived in many different forms, and often with redactions. Many agencies excluded certain arrests, such as arrests of juvenile offenders, and thus we can assume police arrested more people in predicted locations than we were able to document.
No agency in our dataset reported Latino arrest rates to the FBI’s UCR program but rather reported those arrested as either White or Black.
In our arrest-rate analysis, when calculating the arrest rates for days with predictions on a given block, we were unable to identify whether an arrest occurred due to patrol officers being directed to the area by PredPol’s algorithm, due to unrelated patrols, from a crime report from a member of the community, or for some other reason.
PredPol Response
We sent our methodology as well as the underlying data to PredPol, which renamed itself Geolitica earlier this year. The company confirmed that the reports “appeared to be” generated by its software.
Brian MacDonald, CEO of the company, stated that the analysis was based on “erroneous” and “incomplete” data. When asked to explain how it was incomplete, he did not respond.
The errors, he said, were that one department (Jacksonville, Texas) inadvertently doubled up on some shifts, resulting in additional predictions, and that the data for at least 20 departments in the cache included “zombie reports,” which the company generated for internal testing purposes after a department stopped using the software. We kept the Jacksonville data because they were actual predictions delivered to departments.
We also explained to the company that we had confirmed the dates of usage with the departments in our data directly, through contracts and/or through other media reports and discarded predictions that fell outside of it. We offered to provide those usage dates to MacDonald. Instead, he offered to allow us to use the software for free on publicly available crime data instead of reporting on the data we had gathered. After we declined, he did not respond to further emails from us.
In response to questions regarding the software’s disproportionate targeting of Black, Latino, and low-income neighborhoods, MacDonald said that the software doesn’t have any information on the underlying demographic of the areas under patrol. “If those areas received a greater number of patrol boxes, it is because the people who lived in those locations were reporting crimes at a higher rate than in other parts of the jurisdictions.’’ He also referenced a study concluding that there is a direct relationship between poverty and crime rates in a given area.
When we pointed out that we found some jurisdictions using the software to predict drug crimes, something the company has stated the software should not be used for, since these can be selectively enforced in different neighborhoods, he said policing agencies make their own decisions on how to use the software. “We provide guidance to agencies at the time we set them up and tell them not to include event types without clear victimization that can include officer discretion, such as drug-related offenses.”
Law Enforcement Agency Responses
We reached out to every law enforcement agency whose predictions were included in our analysis with a list of questions. Only 13 agencies responded at all, despite multiple attempts, and 11 of those said they were no longer using the software.
- “When I took over as chief, I knew this was a useless tool,” Thomas Mosier, the police chief in Piscataway, said in a telephone interview. “As I remember this system, it was clunky. The ends didn’t justify the means.”
- “As time went on, we realized that PredPol was not the program that we thought it was when we had first started using it,” Sgt. Craig Kootstra, chief of staff of the Tracy, California, police department, said in an email.
- Sgt. Joseph LaFrance, a public information officer at the West Springfield Police Department in Massachusetts, said the agency never shared predictions with individual officers. “We passed on renewing the contract, finding we didn’t need to spend money on a system to tell us what we already knew, [like] we have a shoplifting problem in the Riverdale Plaza,” he wrote in an email.
Alexandria, Louisiana, and Temple Terrace still have contracts with PredPol, but say they are no longer using it.
The sheriff’s office in Boone County, Indiana, and the police department in Decatur were the only two agencies actively using the software who responded to us. Maj. Brian Stevenson, operations commander in Boone County, said his department currently uses PredPol to get a general sense of where crime is occurring, not to inform daily missions but said they could start using it to direct daily patrols in the future.
Sgt. John Bender of the Decatur Police Department said the agency likes PredPol. He said the software helps guide the department’s decisions on where to patrol. “The program as well as the officers’ own knowledge of where crime is occurring assists our department in utilizing our patrol resources more efficiently and effectively,” he wrote in an email.
The only agency whose officials directly expressed concern about the racial and socioeconomic disparities in our findings was the Elgin Police Department in Illinois.
Among the questions we asked were whether the departments made any arrests due to an officer being in a location for a PredPol prediction. Most ignored the question and those that did write said either no or they didn’t know of any.
Conclusion
We found that PredPol’s algorithm as used by dozens of law enforcement agencies disproportionately targeted vulnerable populations, including low-income communities and residents of public housing. We also found that its predictions disproportionately targeted neighborhoods with proportionately more Black and Latino residents.
In at least 74% of the jurisdictions in our data, the least-targeted block groups (many of which had no predictions at all) also had the highest proportion of White residents in the jurisdiction. In at least 84% of departments, a higher proportion of Black or Latino residents lived in the most-targeted block groups compared to the jurisdiction overall.
The poor were also disproportionately targeted. For the majority of jurisdictions in our data, a higher proportion of the jurisdiction’s low-income households lived in the block groups that were targeted the most. In some, nearly all of the jurisdiction’s subsidized and public housing was located in block groups that were targeted the most.
Some block groups were the subject of crime predictions every day and in multiple locations within the same block group. The people most likely to be affected by daily PredPol predictions were residents of public and subsidized housing, among the poorest residents. Our data showed that for 10 jurisdictions (26%), the algorithm predicted crimes would occur in these communities at least once nearly every day the software was used for the agency.
The cascading consequences as a result of a police contact for residents of public and subsidized housing can be severe: In cities with crime-free-housing ordinances like Elgin, police contact, even for low-level offenses and even by the residents’ guests, can lead to eviction.
We also found that PredPol’s predictions mirrored existing arrest patterns. For the 11 jurisdictions that provided us granular arrest data, we found that the blocks most targeted by PredPol were also more likely to be scenes of arrests overall. Our analysis of arrests by race as reported to the FBI Uniform Crime Reporting project by 29 departments in our data (90%) showed Black people were more likely to be arrested than White people in all but three of the jurisdictions.
Acknowledgments
We thank Kristian Lum (formerly of the University of Pennsylvania, now with Twitter), William Isaac (research affiliate at Oxford University and Google Deepmind), Brian Root (Human Rights Watch), Stats.org, Kristin Lynn Sainani (Stanford University), David Weisburd (George Mason University), Laura Kurgan (Columbia University Graduate School of Architecture, Planning and Preservation), and Dare Anne S. Brawley (Columbia University Graduate School of Architecture, Planning and Preservation) for reviewing an earlier draft of this methodology.